

Almost every maintenance dashboard reports a backlog. Almost none of them report a number anyone can act on.
“412 open work orders” tells you nothing. It does not say whether you are one week behind or three months behind, whether you need overtime or a contractor or neither, or whether the situation is improving. It is a count of rows in a table, and it moves whenever somebody changes how requests are raised.
The number that answers the question is maintenance backlog in weeks of work: how long the crew you actually have would take to clear the work you actually have, if nothing new arrived. This page sets out how to calculate it, the five decisions that change the answer, a fully worked example, and an honest note about the benchmark everybody quotes and nobody sources.
What maintenance backlog in weeks means, and why three people mean three different things
Before any arithmetic, the definitional fight has to be settled, because most disagreements about backlog are really disagreements about scope.
There are three populations of work, and each produces a legitimate but different backlog number.
Total backlog is every open work order, whatever its state. It includes jobs waiting on parts that will not arrive for six weeks, jobs waiting on an approval, jobs waiting on a shutdown window in March. It is the honest picture of everything owed.
Ready backlog — the one most useful for planning — is work that could be scheduled next week if you chose to. Approved, parts on hand, permits obtainable, no dependency outstanding. This is the population your crew capacity actually acts on.
Deferred or constrained backlog is everything ready backlog excludes: waiting on money, waiting on parts, waiting on an outage. Reporting it separately matters, because it is a different management problem. A crew cannot work its way out of a parts shortage.
The single most common reporting error is presenting total backlog as though it were ready backlog, then concluding the crew is overwhelmed. Often the crew is fine and procurement is not.
The maintenance backlog in weeks formula, and the one thing it depends on
The formula for maintenance backlog in weeks is itself trivial:
Backlog (weeks) = total estimated labour hours of the work in scope ÷ craft hours available per week
Everything difficult is in the denominator.
Why headcount × 40 is the wrong denominator
Six technicians do not give you 240 schedulable hours a week. They give you 240 paid hours, and the two numbers are far apart.
Out of paid hours come vacation, statutory holidays, sick leave and training. Out of what remains comes reactive work. Breakdowns arrive on the day, and they do not queue politely behind your plan. What is left is the capacity that can be applied to backlog. In our experience it usually lands somewhere between half and two-thirds of the paid figure. We have no dataset to offer you for that, so do not treat it as a benchmark. It is a reason to measure, not a number to adopt.
The error this produces is large and always in the same direction. In the worked example below, available hours come to 57% of paid hours, so a backlog computed on headcount × 40 would be understated by 43% — a crew reporting two weeks would in fact be three and a half. This single substitution is, in our experience, the most common reason a backlog number is quietly wrong.
Measure your own factors rather than borrowing anyone’s. Your absence rate is in your payroll system, and your reactive share is in your own work order history — the ratio of unplanned to total labour hours over the last quarter is a better estimate than any published figure.
Five decisions that change your maintenance backlog in weeks
Two competent people, given the same database, will produce different maintenance backlog in weeks figures. Not because either is wrong, but because five decisions sit underneath the calculation and are rarely written down.
Which statuses count as backlog
Does work awaiting approval count? Work on hold for parts? Work created but not yet triaged? Each answer is defensible. What matters is that you fix one and state it. If your backlog number moves because somebody added a status, the metric is measuring your configuration rather than your workload.
Estimated hours, or actual hours from history
Estimates are what you have for work not yet done, so the calculation uses estimates. But if your estimates are systematically optimistic — and most are — your backlog is systematically understated. The check is cheap: for completed work over the last quarter, compare estimated to actual hours and derive a correction factor. If jobs consistently take 1.3× their estimate, your backlog is 30% larger than the arithmetic says.
What to do with unsized work
This is the big one, and the one most systems get wrong silently. A work order with no estimate contributes zero hours to a naive sum. Twenty unsized jobs simply vanish. The backlog looks better precisely because the planning is worse — an incentive nobody intended and everybody has.
Backlog per craft, not backlog overall
An organisation-wide backlog of three weeks can conceal an electrical backlog of eight weeks and a millwright backlog of one. Because crafts are not interchangeable, the aggregate figure describes a crew that does not exist. Calculate per craft, and report the aggregate only as a rollup of figures that each mean something. This is also the point at which a work order register that records labour per person per craft starts to matter more than one that records a single duration.
Absences, shift patterns and the working week
A crew on four ten-hour days has a different weekly capacity from a crew on five eights. A crew with two people on vacation has a different capacity this week from last. If the denominator is a constant, the backlog trend will show movement that is really just the holiday calendar.
A worked example: maintenance backlog in weeks, three ways
A millwright crew of six. Here is the whole calculation, with every assumption stated.
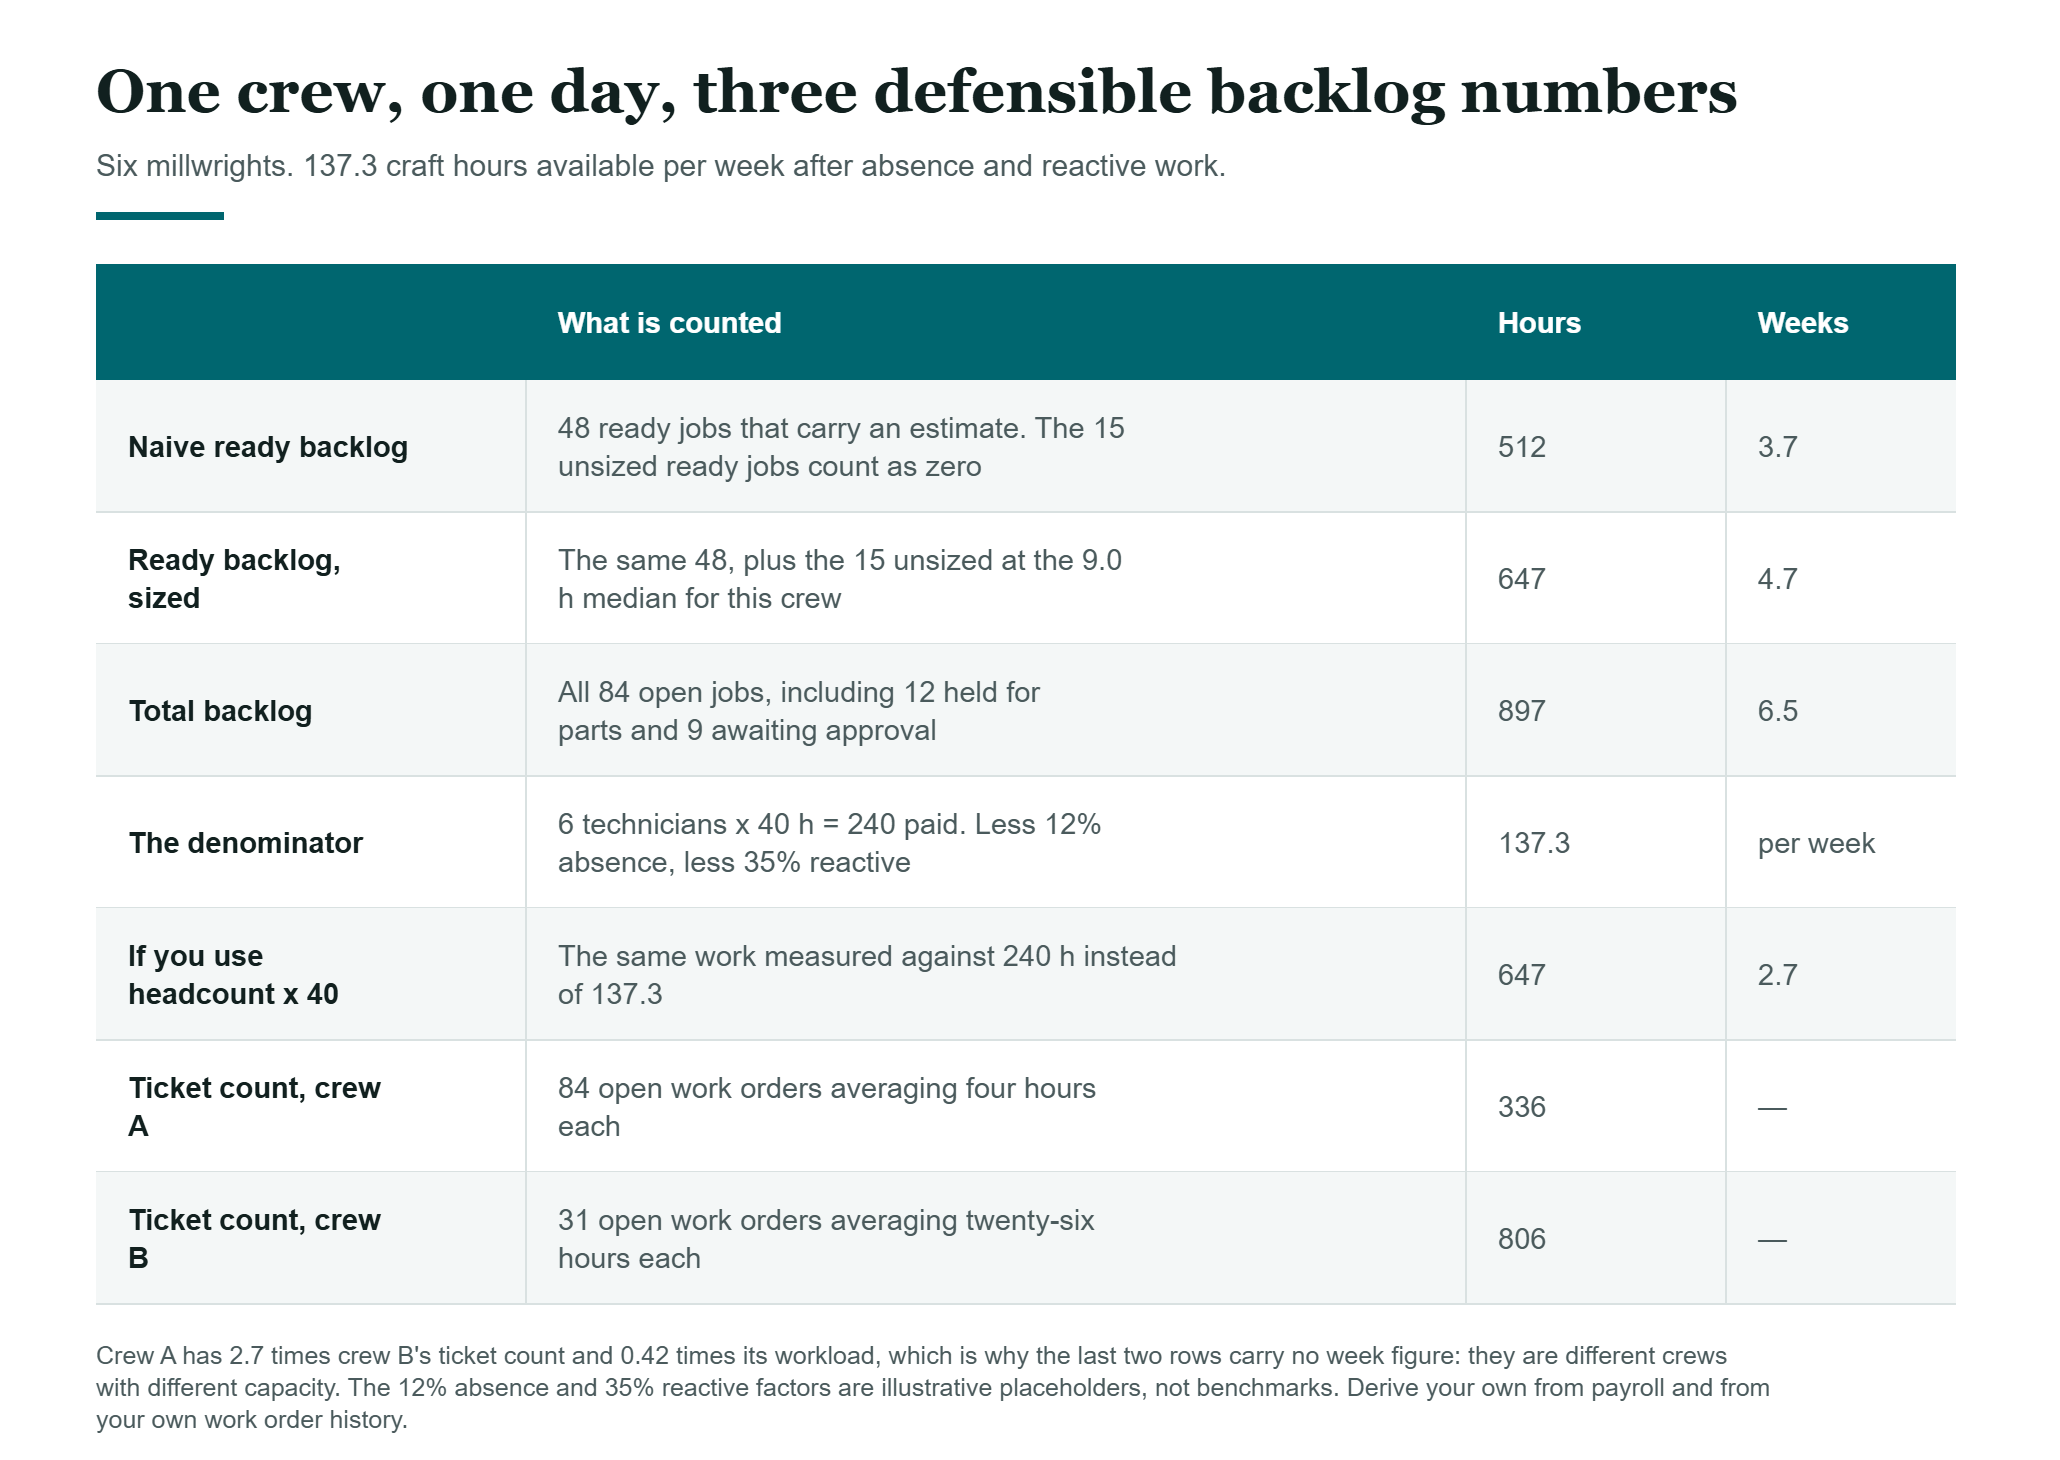
The denominator. Six technicians at 40 hours is 240 paid hours a week. Payroll shows 12% lost to vacation, statutory holidays, sick leave and training. That leaves 211.2. Work order history shows unplanned work has consumed 35% of millwright labour over the last quarter, leaving 137.3 hours a week available for planned backlog work.
The numerator. There are 84 open millwright work orders. Twelve are on hold awaiting parts and nine are awaiting approval, so 63 are ready to schedule. Of those 63, forty-eight carry estimates totalling 512 hours — a mean of 10.7 hours but a median of 9.0, the gap being the usual long right tail. Fifteen have no estimate at all.
Take the naive figure first:
512 ÷ 137.3 = 3.7 weeks of ready backlog
What the unsized jobs do to the maintenance backlog in weeks
Now deal with the fifteen unsized jobs. Apply the median of 9.0 hours. We use the median rather than the mean, for the reason set out in the next section. That adds 135 hours:
(512 + 135) ÷ 137.3 = 647 ÷ 137.3 = 4.7 weeks of ready backlog
The naive figure understated the ready backlog by 21%, entirely because fifteen work orders had an empty field.
Now the total backlog, including the parts and approval holds. That is 690 estimated hours across all sized work, plus 23 unsized jobs at the same median:
(690 + 207) ÷ 137.3 = 897 ÷ 137.3 = 6.5 weeks of total backlog
Three numbers — 3.7, 4.7 and 6.5 weeks — all correct, all from the same database, all describing the same crew on the same day. Which one you report is a choice. Reporting one without saying which is how backlog metrics lose credibility.
Why a count of work orders lies
Take two crews.
Crew A has 84 open work orders averaging four hours each: 336 hours of work. Crew B has 31 open work orders averaging twenty-six hours each: 806 hours.
By ticket count, Crew A’s queue is 2.7 times the size of Crew B’s. By labour hours, Crew B’s is 2.4 times the size of Crew A’s. The two metrics do not merely differ in precision — they point in opposite directions, and a manager acting on the count would move help to exactly the wrong crew.
This is not a contrived example. Any organisation whose work mixes short corrective jobs with long overhauls will produce it, which is to say most of them.
Three honest ways to size unsized work
Since unsized work is where maintenance backlog in weeks breaks, it is worth being deliberate about it. There are three defensible approaches and one indefensible one.
Median by work type. For each work type, compute the median actual hours of completed jobs over a trailing window, and apply it to unsized jobs of that type. Choose the median rather than the mean, because maintenance durations have a long right tail and one turbine overhaul drags a mean somewhere useless.
A stated craft default. Simpler and cruder: one default estimate per craft, reviewed quarterly. Less accurate than a per-type median, but transparent and hard to argue with, which sometimes matters more.
Exclude and disclose. Leave unsized work out of the calculation entirely, and report the count alongside. In the example above that reads “3.7 weeks of ready backlog, excluding 15 unsized work orders.” This is honest, and it puts visible pressure on the planning gap rather than papering over it.
The indefensible approach is the one we have seen most often: sum the estimates, treat blanks as zero, and print the result with no footnote. That is not an estimate with a known error — it is a number whose error is invisible and always in the same direction.
About the “two to four weeks” benchmark
Search for a backlog target and you will be told, repeatedly and confidently, that healthy ready backlog is two to four weeks per craft. Dozens of vendor pages state it, usually with no source.
What SMRP actually publishes
Here is what we could actually verify. SMRP — the Society for Maintenance & Reliability Professionals — does publish a metric for this. The metric is numbered 5.4.9, Ready Backlog. Its heading in the source reads “Ready Backlog (based on a 40 hour workweek)”, and the formula given is “Ready to Schedule Backlog (weeks) / Craft Available.” We read that in SMRP’s own 2014 metrics workshop workbook, hosted publicly by PEMAC, the Plant Engineering and Maintenance Association of Canada. It is © 2014 SMRP.
Note the parenthetical, because it matters for everything above: the metric as published assumes a 40-hour workweek per craft head. If you use the denominator we argue for — paid hours net of absence and reactive work — your number will not be comparable to anybody quoting 5.4.9 unadjusted.
That document states no target range and no benchmark in weeks. We swept the full text for “target”, “benchmark”, “world class”, “best in class” and for the figures themselves. It offers the metric as an assessment tool, not a prescriptive standard.
SMRP’s full Best Practices guide is sold rather than published, and we did not buy it, so we cannot tell you whether a target appears there.
Where the two-to-four-week figure came from
What we did find is where the folklore may have come from, and it suggests the number has been garbled in transit. Noria’s Reliable Plant publishes a widely-read piece on the subject. For a typical 24/7 continuous-process operation, it suggests “a good starting objective would be to have a ‘total backlog’ of about four weeks, a ‘planning backlog’ of about two to four weeks and a ‘ready-to-schedule’ backlog of one to two weeks.” It cites no source for those figures either — they are presented as the author’s recommendation.
So the two-to-four-week figure that circulates as a ready backlog target appears, at least in one prominent telling, to be the planning backlog figure with the label rubbed off. The ready-to-schedule recommendation in the same sentence is half that. If you have been benchmarking yourself against four weeks of ready backlog, it is worth knowing that the trail leads to an unsourced recommendation about a different population of work.
Treat it as folklore with a plausible basis rather than as a standard. The underlying logic is sound enough — too little ready backlog and your planners cannot build an efficient schedule; too much and work ages before it is done — but the specific numbers deserve less authority than they are given. Your own trend is worth more than somebody else’s benchmark.
What maintenance backlog in weeks does not tell you
Maintenance backlog in weeks is a good metric. It is not a complete one, and three things it cannot see are worth naming.
It says nothing about risk. Six weeks of backlog consisting of cosmetic work is a different situation from two weeks containing a safety-critical inspection that is overdue. Backlog is a volume measure; criticality is a separate axis and needs separate reporting.
It says nothing about age. A steady four-week backlog can be four weeks of constantly refreshed work, or the same jobs sitting untouched for a year while newer work jumps the queue. Backlog age distribution — the oldest quartile in particular — catches what the headline number hides.
It says nothing about whether the work should exist. Some backlog is nothing but the residue of PM tasks nobody has reviewed since the plant opened. Clearing that work is worse than deleting it, and no volume metric will tell you which you are looking at.
Four levers when the maintenance backlog in weeks is too large
Suppose the number comes back at nine weeks and everyone agrees that is too many. We can think of four things you can do about it, and they are worth naming separately because organisations habitually reach for the first and ignore the other three.
Add capacity. Overtime, contractors, a new hire. The obvious lever, the expensive one, and the only one that works if the backlog is genuinely a resourcing shortfall rather than a symptom. Note that it acts on the denominator, so its effect is easy to model in advance: 137 hours a week becoming 180 turns the 4.7-week ready backlog above into 3.6.
Reduce intake. Most maintenance backlogs are fed by an intake nobody has audited. Duplicate requests for the same fault, requests that should have been a five-minute fix at the point of report, and — very often — PM tasks on a frequency nobody has reviewed since the equipment was commissioned. A PM review that removes genuinely low-value tasks is the cheapest week you will ever take off a backlog.
The two levers organisations forget
Reduce scope per job. Long jobs sit longer, because they need a bigger window. Splitting a twenty-six-hour overhaul into three schedulable pieces does not reduce the hours, but it dramatically improves the chance any of them get done before the next shutdown.
Deliberately defer, and say so. The lever nobody likes. Moving work out of ready backlog into an explicitly deferred population, with a reason and a review date, is more honest than leaving it to age silently at the bottom of a queue. It also converts an invisible problem into a visible decision, which is usually the point at which someone funds it.
The reason to identify the lever before acting is that the four have different costs and different failure modes. Adding capacity to a backlog that is really a parts problem buys you idle technicians.
How often to measure, and what to look at
Measure maintenance backlog in weeks weekly, at the same point in the week, per craft. The absolute number matters much less than its direction over eight to twelve weeks. The absolute number carries all five of the decisions above. The trend largely cancels them out, provided the decisions stay fixed.
Two habits make the metric trustworthy. Write the five decisions down, in one paragraph, and publish them next to the number. And recompute the denominator each quarter rather than treating capacity as a constant; crews change, absence rates drift, and the reactive share moves with the season.
If the trend is flat and the number is uncomfortable, the honest conclusion is usually that intake and capacity are balanced at a level you have decided to live with. That is a resourcing conversation, not a maintenance one — and maintenance backlog in weeks is the only version of the number that makes the conversation possible.
Frequently asked questions
How do you calculate maintenance backlog in weeks of work?
To get maintenance backlog in weeks, divide the total estimated labour hours of the work in scope by the craft hours genuinely available per week. Available hours are not headcount × 40 — subtract vacation, statutory holidays, sick leave and training, then subtract the share of capacity that reactive work consumes.
What is the difference between total backlog and ready backlog?
Total backlog is every open work order regardless of state. Ready backlog is only work that could be scheduled next week — approved, parts on hand, no outstanding dependency. Ready backlog is the figure to use for crew planning; total backlog is the figure to use for the overall commitment.
Is two to four weeks a good maintenance backlog in weeks?
It is the figure most commonly quoted, but we could not verify it against a freely available primary source. SMRP defines the Ready Backlog metric as 5.4.9, and the SMRP metrics workshop workbook we read states no target range at all. The most prominent free source that does give numbers, Noria’s Reliable Plant, recommends two to four weeks for planning backlog and one to two weeks for ready-to-schedule backlog — which suggests the widely quoted figure has been attached to the wrong population of work. Treat it as convention rather than standard, and give more weight to your own trend.
Why is counting work orders a bad backlog metric?
Because work orders are not equal in size. A crew with 84 four-hour jobs has less work in front of it than a crew with 31 twenty-six-hour jobs, but 2.7 times the ticket count. Acting on counts sends help to the wrong crew.
What should you do about work orders with no time estimate?
Either apply the median actual hours of completed jobs of the same work type, or apply a stated per-craft default, or exclude them and report the excluded count alongside the number. What you should not do is let them count as zero silently, which is the behaviour we have seen most often and always understates the backlog.
Should backlog be measured per craft or overall?
Per craft. Crafts are not interchangeable, so an overall figure describes a crew that does not exist and can hide a serious shortfall in one trade behind slack in another. Report the aggregate only as a rollup of per-craft figures.
A note on method
The worked example is constructed, not drawn from a customer, and every figure in it is stated so the arithmetic can be checked. The factors used — 12% absence and a 35% reactive share — are illustrative placeholders, not benchmarks; substitute your own, which you can derive from payroll and from your own work order history.
Two external sources are relied on: the SMRP Best Practice Metrics Workshop workbook (© 2014 SMRP), read from the copy hosted by PEMAC, and Noria’s Reliable Plant article on backlog. We did not purchase the SMRP Best Practices guide, and we have not represented its contents.
We checked this page adversarially against its own arithmetic before publication. That pass caught three errors we had made. The worked example originally divided a total by a count and called the result a median — the exact mistake this article warns against. A disclosure figure reconciled with nothing. And a ticket-count ratio had been rounded from 2.7 up to “three times”, in an article about people rounding away the truth. All three are corrected above. We mention it because a page arguing for arithmetic honesty should show its own.
If you would rather not do the arithmetic by hand, we keep a set of maintenance calculators that take the same inputs.
If your own numbers contradict anything here, your numbers win.