

Somebody says the floor runs at 47%, and the room asks the only sensible follow-up: forty-seven per cent of what? Nine times out of ten the answer is a shrug, and the meeting moves on. That is the real problem with space utilisation. Not the arithmetic, which is trivial, but the divisor, which nobody prints.
This guide covers calculating space utilisation for desks and meeting rooms. The formula. A worked example small enough to check by hand. The four decisions that move the number far more than the formula does. And how to publish a figure that survives a budget meeting.
The space utilisation formula, in one line
Every honest version of this metric is the same shape:
Space utilisation = bookings ÷ space-days
where space-days = bookable spaces × working days in the period
A space-day is one space available for one working day. It is the unit of supply. If you have 16 bookable spaces and a 22-day month, you had 352 chances for somebody to use something. Count how many people took, divide, and that is your rate.
Everything difficult about this metric lives in two words: bookable and working. Change either definition and the same month produces a different percentage. That is exactly why the number needs its divisor attached.
A space utilisation example you can check by hand
Take one floor. Level 2 of a three-site estate carries 22 spaces: 12 desks, 4 meeting rooms and 6 spaces nobody should book. A plant room, two corridors, a store and two spaces out for refit. That leaves 16 bookable. The month has 22 working days, and people made 165 bookings in it.
| Spaces drawn on the floor | 22 |
| Of those, bookable | 16 |
| Working days in the period | 22 |
| Space-days (16 × 22) | 352 |
| Bookings in the period | 165 |
| Space utilisation (165 ÷ 352) | 47% |
That is the whole calculation. A spreadsheet handles it, and for one floor over one month you probably should use one. It is the fastest way to find out whether your list of spaces is accurate, because the arithmetic falls apart if it is not.
Four decisions that move the number more than the formula does
1. What counts as bookable
The divisor should contain the spaces a person could actually have taken. Plant rooms, corridors and a room out for refit are not supply. Counting them makes the estate look worse than it is. Long-term assigned desks are the harder case. Somebody holds them, so they are not free, but nobody can book them either. Report them separately, as their own question. Drop them into the same percentage and you average two different things, and the result answers neither.
2. What counts as a working day
A month with a statutory holiday offers fewer chances to use a desk, not the same number badly used. Fix your divisor at 22 every month and a short week shows up as a dip that has nothing to do with behaviour. Configure the working calendar once, and let a short week read as a short week.
3. What you do with floors you have not drawn
This is the one that quietly ruins the number. Say twelve floors exist and somebody has drawn nine. The three undrawn floors hold no spaces in the system, so a tool that rolls them into the estate average treats them as empty. That flatters nothing and nobody. It produces a low estate-wide figure your facilities team knows is wrong, which is how a utilisation report loses its audience. Exclude undrawn floors, and name them on the report as what the figure does not cover.
4. Booked, or actually used
A booking is an intention. A check-in is a fact. Say nobody honoured 15 of those 165 bookings: the desk held at nine, empty at ten. The floor then reads 47% booked and 43% used, and that four-point gap is the most actionable thing on the page. It has a name, the no-show rate. It tells you whether your booking data measures anything at all.
The same floor, four defensible numbers
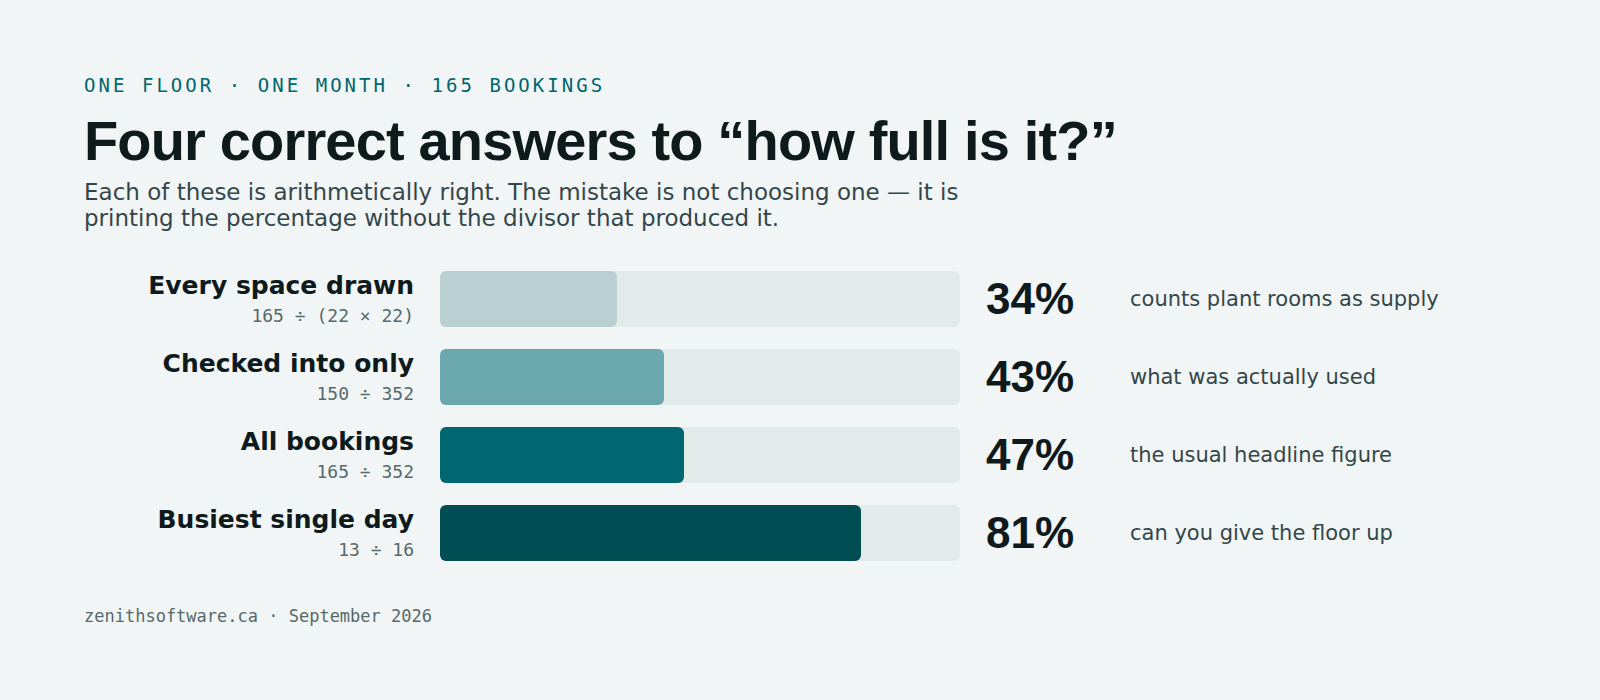
Here is the uncomfortable part. One floor, one month, 165 bookings. Every line below is an arithmetically correct space utilisation figure:
| What you counted | The arithmetic | Result | What it is good for |
|---|---|---|---|
| Every space drawn on the floor | 165 ÷ (22 × 22) | 34% | Almost nothing — it counts plant rooms as supply |
| Bookings that were checked into | 150 ÷ 352 | 43% | Whether the floor was used, not just claimed |
| All bookings against bookable spaces | 165 ÷ 352 | 47% | The standard headline figure; good for trend |
| The busiest single day | 13 ÷ 16 | 81% | Whether you could give the floor up |
None of these is a trick. They answer four different questions. The mistake is not picking the wrong one. It is reporting one of them without saying which. A room that hears “34%” and a room that hears “81%” will make opposite decisions about the same floor.
Which space utilisation number answers which question
- Mean booking utilisation — the headline. Use it for trend over months, on a divisor you never change mid-year.
- Check-in utilisation — use it when somebody challenges whether bookings reflect reality. The gap between this and the headline is your no-show rate.
- Peak-day occupancy — use it, and only it, for the question “can we release this floor”. You do not size a floor for its average Tuesday; you size it for the day everybody came in. A floor averaging 47% that hits 81% on Wednesdays needs a plan for Wednesdays before you give it up.
- Assigned-desk reporting — a separate table, not a percentage mixed into the others. How many desks somebody holds long-term, who holds them, since when.
If you publish only one number, publish the mean with the peak beside it. Most bad real-estate decisions in this category come from a mean presented alone.
Rooms are measured in hours, desks in days
Desk space utilisation works in space-days, because a desk generally goes for a whole day. A meeting room goes for 45 minutes, so counting it as “booked today” throws away most of the information. For rooms, move to hours:
Room utilisation = booked hours ÷ (rooms × bookable hours per day × working days)
Four rooms, a 9-hour bookable day and 22 working days gives 792 room-hours of supply. Book 297 of those hours and the rooms ran at 37.5%. That figure usually interests people more than the desk number, because meeting rooms are where the scarcity complaints come from even in a half-empty building. Two follow-up cuts are worth having. Utilisation by room size: do two-person calls fill the six-seaters? And utilisation by hour of day: is the problem capacity, or does everybody want 10am?
What space utilisation cannot tell you
The metric is useful and it is narrow. Being clear about the edges is what makes the rest of it credible.
- It does not count people. Booking data knows somebody took a six-seat room. It does not know two people sat in it. If that specific question carries your business case, you are looking at occupancy sensing, which is a different project with hardware in it.
- It does not produce cost per seat. Cost per desk needs floor area and a lease cost. Without those in your system, the figure has nothing behind it. A tool that shows you one anyway divided by something convenient.
- It does not explain itself. A floor at 22% might sit in the wrong place, lack the right equipment, or house a team that works from home. Utilisation tells you where to go and ask. It does not answer the question you find there.
- It is not comparable between organisations. Benchmarks in this category rest on incompatible divisors. Your utilisation figure means something against your own figure last quarter, and very little against somebody else’s press release.
The people it never saw
It also cannot tell you about people who never booked at all. In a Canadian context that matters, because hybrid patterns remain uneven and still moving. Statistics Canada found that in May 2024, 18.7% of employed people worked mostly from home, down from 20.1% a year earlier. About 1.1 million hybrid workers commute some days and not others. A floor plan that only sees bookings sees the days people opted in. Where you need more than that, and some estates genuinely do, sensor, badge-line or building-system feeds supply it alongside the bookings. An integration, not a prerequisite.
How to publish a space utilisation number people will believe
Write the figure as a statement, not a percentage. Five lines is enough, and it ends the “of what?” conversation before it starts:
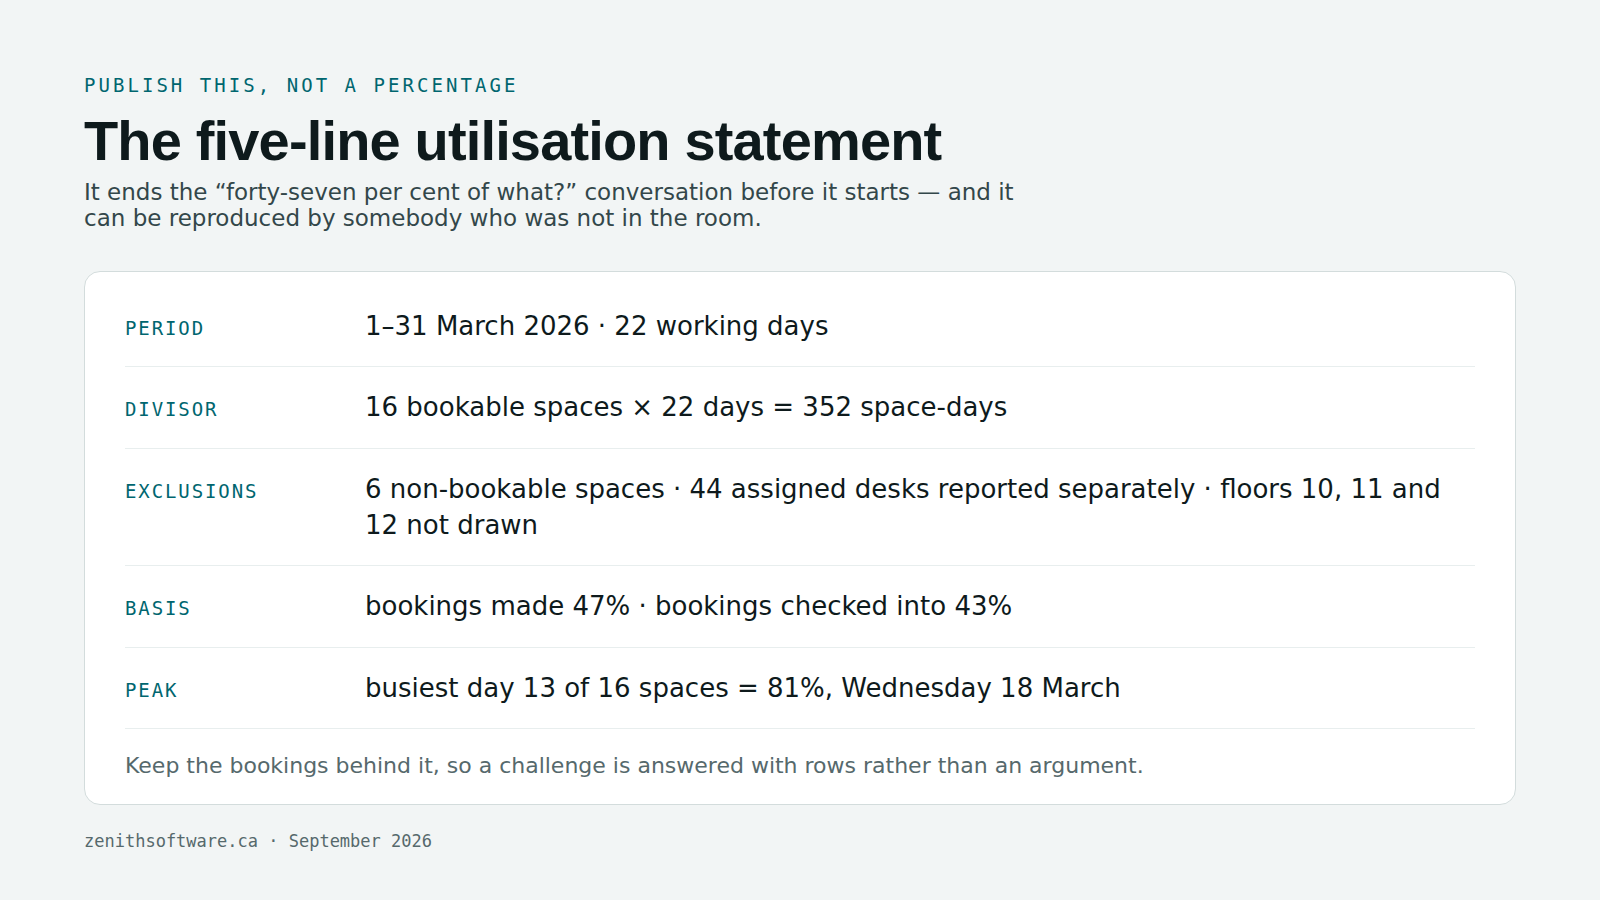
- Period. 1–31 March 2026, 22 working days.
- Divisor. 16 bookable spaces × 22 days = 352 space-days.
- Exclusions. 6 non-bookable spaces; 44 assigned desks reported separately; floors 10, 11 and 12 not yet drawn and not included.
- Basis. Bookings made (47%); bookings checked into (43%).
- Peak. Busiest day 13 of 16 spaces, 81%, Wednesday 18 March.
Three habits make that statement easy to produce. Keep the register of spaces as the single source of truth, so the divisor becomes a query rather than a spreadsheet somebody maintains. Fix the working calendar once, so short months read as short. And keep the underlying bookings, so you can hand anybody who disputes the figure the rows instead of an argument.
In the Canadian public sector this has become the expectation rather than a nicety. Programmes like GCworkplace have pushed activity-based and unassigned workspace far enough that “how do you know” is now a standard question. Somebody who was not in the room has to be able to reproduce your answer. Municipal institutions face a further turn of the screw: from January 2027 a municipal space booking system needs a privacy impact assessment before it collects anything.
Questions people actually ask
What is a good space utilisation rate?
No honest universal benchmark exists, because no two organisations use the same divisor. Published figures for hybrid offices often land in the 40–60% range. But a 47% that excludes plant rooms and a 47% that includes them describe very different buildings. Compare your own figure over time on a divisor nobody has changed, and your peak day against your capacity. If a business case needs an external number, state the divisor you used and let the reader adjust.
What is the difference between utilisation and occupancy?
Utilisation usually means a ratio of use to supply over a period: how much of what you have went out. Occupancy usually means a point-in-time count of how many people or spaces are in use right now. In practice people use the words loosely and often interchangeably. Define the one you mean on the report rather than assume your reader shares your definition.
Do I need sensors to measure space utilisation?
Only if the question is genuinely about people who never booked anything. Bookings plus check-in tell you what somebody reserved and what they honoured, with no hardware to own. Check-in also does something a sensor cannot: it releases an unused space so somebody else can take it. Sensors answer a narrower, more expensive question, namely how many bodies filled the room. They earn their cost when that question actually drives a decision. We compare the two directly in occupancy sensors versus booking data.
How long a period should I measure?
A month is the minimum for a stable figure and a quarter is better. Avoid drawing conclusions from December or July. Watch the day of the week too. Most hybrid estates have a two-day peak and a dead Friday, and a monthly mean hides both.
Should assigned desks be in the divisor?
Not in the bookable-space divisor, no. Nobody could have booked them. Report them as their own line: how many desks somebody holds, and what the floor around them looks like. Slip assigned desks quietly into the bookable count and your utilisation figure goes wrong in the direction that flatters the estate. That is the worst direction for it to go wrong in.
Can I calculate space utilisation in a spreadsheet?
Yes, and for one floor over one month you should. It stops working once the list of spaces starts changing: a fit-out, a move, a room out of service. Now the spreadsheet and the building disagree, and only one of them gets updated. That is the moment the divisor stops being trustworthy. It is also the real reason to hold spaces and bookings in one space management system rather than two.
How do statutory holidays affect the calculation?
They reduce the supply, so they should reduce the divisor. A month with two statutory holidays has 20 working days, not 22. Compute against a fixed number and a normal month looks like a decline. If your reporting tool will not take your own working calendar, expect to explain the same artefact every quarter.
Where to start
Pick the floor nobody can account for. Count the spaces on it and decide which are genuinely bookable. Count the working days. Divide one month of bookings by the result, and that is your space utilisation. Then write the five-line statement and take it to the next budget conversation. You will learn more from that one honest floor than from an estate-wide dashboard nobody can reproduce.
We built Zenith Workplace so the divisor comes out of the same system as the drawing and the booking. Excluded spaces named. Undrawn floors listed rather than averaged in. The peak day sitting beside the mean. Canadian-owned, Canadian-hosted, bilingual, and honest about what it does not measure.
Every figure here comes from a small demonstration estate, so you can check each step by hand. We verified the external data in September 2026.
Published by Zenith Software Corp., Victoria, British Columbia · September 2026