
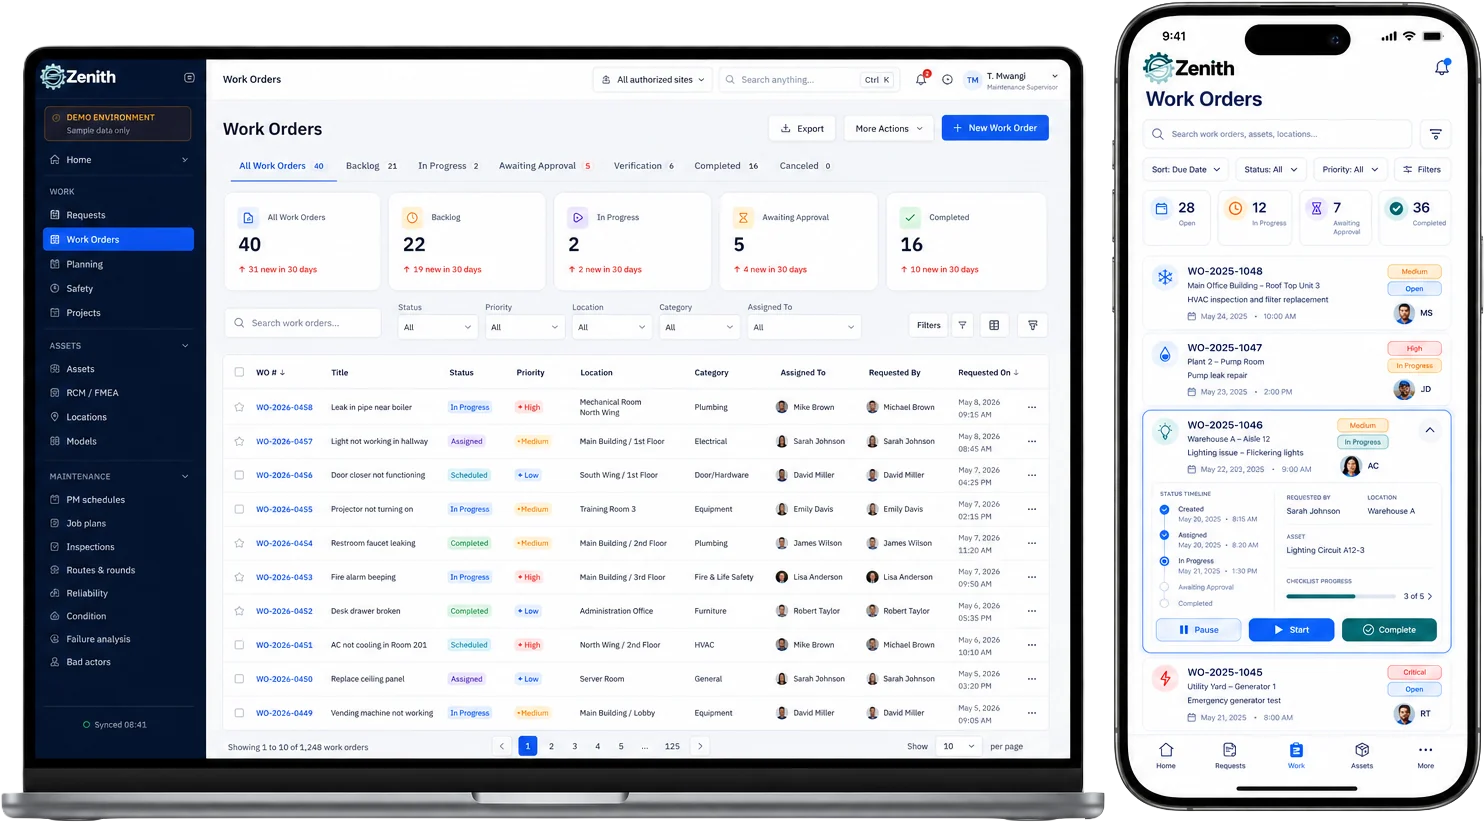
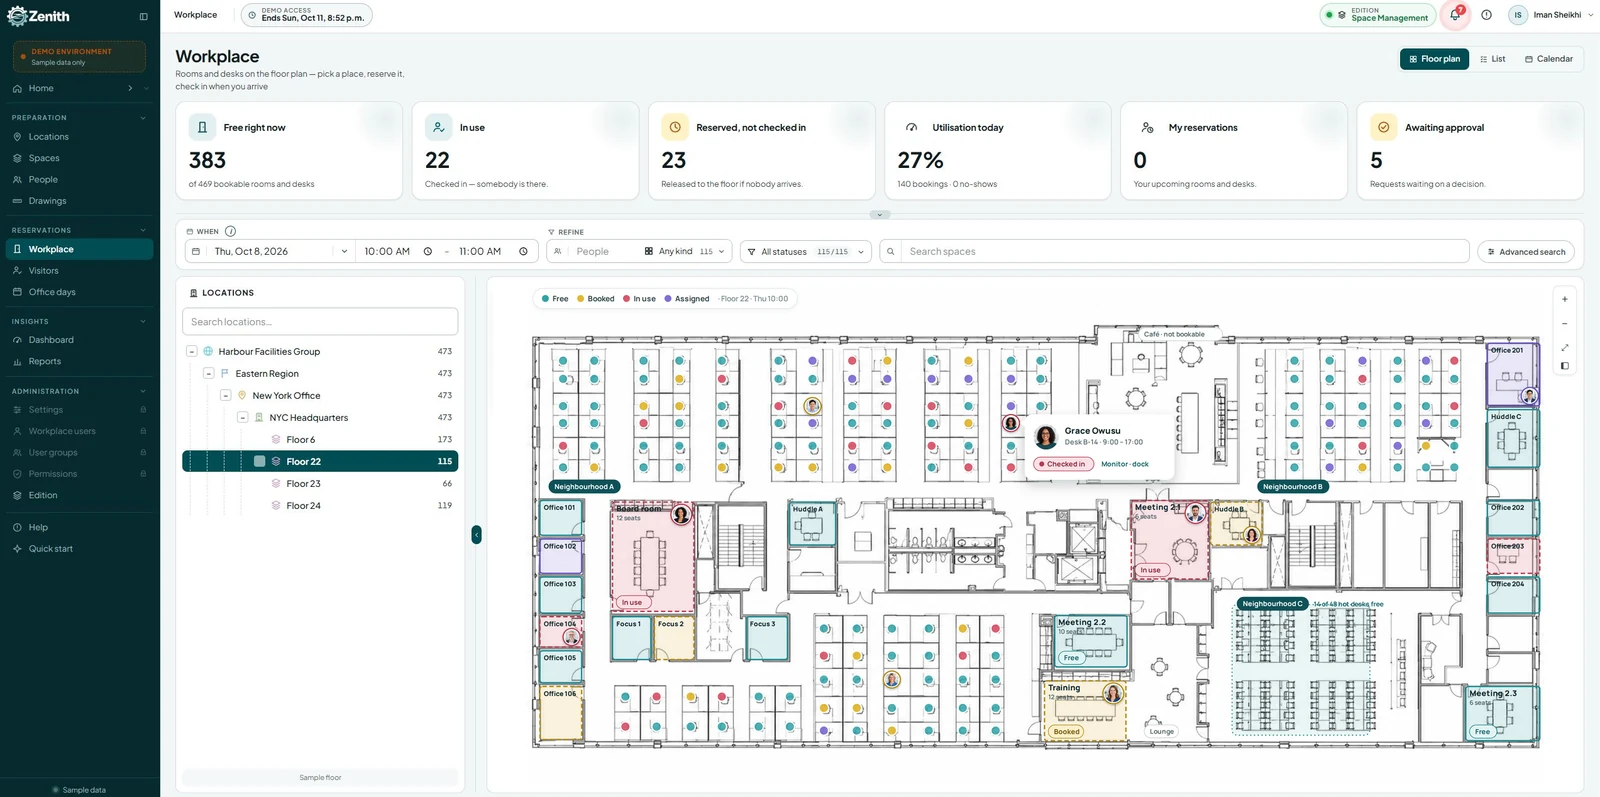

A report stores the question. Not the answer.
Every figure on these screens is computed from the registers at the moment somebody asks — folded out of the same rows the working screens read, so a tile can never disagree with the register a click lands on. And every answer arrives with its receipt: what it started from, and what each filter took out.
Bilingual EN / FR · Multi-site · WCAG 2.2 AASix things make a report
A report is a question you keep, not a spreadsheet you exported. It names a register, the fields you want, the filters that narrow it and the shape of the answer — and the answer is computed when somebody opens it, from the live registers, every time.
A source
One register: work orders, requests, assets, parts, purchase orders or projects. Each is flattened with the same helpers its own screen uses, so “open” means on the report exactly what it means on the register page.
Columns
The fields the table shows. Every field the source has, including the derived ones — open, overdue, site, order value — because those are the answers people actually want.
Filters, in order
Applied one after another, each one's removals counted separately. The order is visible because it is part of the answer.
One grouping
Group by a field and the groups sort largest first. One level, deliberately — a report you can read aloud beats a pivot nobody can reproduce.
Count or sum
Count the rows, or sum a named number field — and only number fields are offered, so a sum over text is never assembled by accident.
A refusal, not a guess
A filter naming a field the source does not have refuses rather than silently matching nothing. Zero rows is an answer, and it is the wrong one.
“Open work by site: 14” convinces nobody
Not until it also says it started from thirty-one work orders, and which filter removed which seventeen. So every answer prints its receipt: the rows the source offered, then one line per filter with what it took out, in the order applied. A filter that removed nothing is as informative as one that removed half the register.
- Computed live, cached never — a stored answer is a cache with an opinion about staleness, and a stale number with a confident face is worse than a slow one.
- The answer moves while you build the question — change a filter's value and the result and its receipt recompute beside you as you type.
- A report cannot disagree with the register — each source is flattened with the same helpers the owning screen uses, so the report and the page it links to are reading one definition of “open”.
- Groups sum to the total — by construction, not by reconciliation, and the ordering is stated rather than chosen.
Zero rows is an answer, and a wrong one
A report whose filter names a field the source does not have has to refuse. The alternative — matching nothing and printing a confident zero — is the failure mode that makes people stop trusting reports, because it looks exactly like good news.
- The refusal is a sentence — it names the field and where it was used, so the fix is obvious rather than a hunt.
- A sum needs a field, and only numbers are offered — the picker filters to number fields, so the invalid version cannot be assembled in the first place.
- Widgets inherit it — a dashboard tile whose report cannot run says so on its face rather than showing an empty chart that reads as “nothing wrong”.
- The refusal is checked, not cached — edit the report and the tile stops complaining the moment the definition is valid again.
Six domains, and every number folds out of the register
Work orders, service requests, preventive maintenance, inventory, labour and asset analytics — each with its own period and tiles that open the register they were computed from. The difference from most dashboards is where the numbers come from: not a server procedure returning a figure nobody can check, but the same stores the working screens read.
What is open, and what closed
Open, in progress, on hold, awaiting approval, overdue, finished in the period — with open work by status and by priority, and raised versus finished across the window.
The funnel, honestly
Requests reported in the period followed through: submitted, acknowledged, accepted, converted to work — and whether that work actually finished.
Compliance against the line
Month by month against the 90% target, the overdue schedules worst-first, and what falls due in the next thirty days.
Out, low, healthy
Judged on available rather than on hand — with the parts that carry no reorder point counted and named rather than quietly folded into “healthy”.
Hours, and where they went
Hours logged, technicians who logged them, hours per finished job, hours by craft, and estimated against actual by work type.
Fleet health and the bad actors
Machines with open issues, mean repair time over twelve months, the planned-to-reactive mix, and the equipment doing the damage.
A total that is the sum of its sites by construction
One row per site — open, overdue, in progress and ninety-day PM compliance — each figure computed by the same folds the site's own dashboard uses. An enterprise number that is not the sum of its site numbers is a bug this makes impossible to write. Pick a row and every figure on the page narrows to that site.
- Site is applied at the source, not as a mask — the same figures, narrowed the same way the registers narrow, rather than an enterprise number with a filter drawn over it.
- Tiles open the register they came from — the number and the rows it counted are one click apart.
- Receipts here too — “3 cancelled work orders excluded”, “2 stocked parts have no reorder point and are not judged”, “4 finished jobs had no estimate and are excluded — unestimated is not free”.
- A figure that cannot be computed says so — “Cannot be computed — no failures with repair time on record”, rather than a zero somebody will act on.
Every mark is a rectangle, an arc or a polyline
The dashboard this replaced carried a charting library. This one carries none: donuts, trend lines, ranked bars and stacked segments are inline SVG and CSS the platform draws itself. That is a page which loads fast, prints predictably, follows your theme, and cannot break because somebody else shipped a new major version.
- The palette comes from your design tokens — six colours, cycled, so a dark theme is a variable change rather than a second stylesheet.
- Every chart has a text equivalent beside it — legends carry the counts and the shares, so nothing is only expressed as a colour.
- Nothing is fetched to render a figure — no CDN, no third-party bundle, and no external script that gets to see your data on its way past.
- Trend buckets widen with the window — weekly, then fortnightly, then monthly, so a year reads as twelve marks rather than fifty-two.
Composed by role, not arranged by hand
“Role workspace” usually means a settings screen where somebody arranges tiles — which is a feature for the two people who will ever use it. What a technician needs on a Monday and what a planner needs are different pages, and the product already knows which one is signed in.
- Modules contribute panels; the page renders whatever announced itself — instead of a hard-coded list of imports from every module, which is the coupling every home screen eventually becomes.
- Three roles means three sets of panels — in role order, because that is what a working supervisor who also holds tools actually is, and each panel appears once rather than three times.
- One date window, every tile — with “all” as the default, because a count of open work is a statement about now rather than about a window.
- Legend rows are doors — clicking a slice opens the register already wearing that filter, rather than leaving you to rebuild it.
Everything around the number
A dashboard is a wall of reports
Put a saved question on a wall as a number, a bar list or a table, and reorder it. A widget owns no data — it names a report and a shape, so improving the report improves every wall it hangs on.
Tiles that open the register
Twenty of them, each landing on the screen its figure was folded from — because the second question after “how many?” is always “which ones?”.
Quick reports on the rail
Every saved question sits beside the dashboard, one click from a live answer — so the report library and the dashboard finally share one definition of a report.
Periods that mean what they say
Today, this week, last seven days, this month, last thirty, last three months, this year — with Monday-based weeks and real calendar months, not rolling approximations of them.
Trends that read at any width
Buckets widen with the window — weekly, then fortnightly, then monthly — so a year reads as twelve marks rather than fifty-two ticks nobody can distinguish.
The target is drawn, not implied
The PM compliance trend draws the 90% line, so “are we above it?” is a glance rather than an arithmetic exercise performed by everyone in the room separately.
Colour that means something
Thresholds are stated rather than felt, and a figure inside its tolerance is not coloured for attention — because colouring everything teaches people that the colours mean nothing.
Your words, everywhere
Rename Work Order, Asset or Storeroom and every label on every tile follows — never what a filter matches on.
Switchable per site
The operations dashboard can be turned off for a site, and the message says exactly where an administrator turns it back on. Saved reports are unaffected.
Numbers somebody can reproduce
Analytics is the module where trust is won and lost fastest. One figure that cannot be traced back to rows, one total that does not match its parts, and every number on the screen becomes decoration for the rest of the year.
Answers, never caches
Nothing stores a computed figure. Every number is folded when it is asked for, so there is no staleness to reason about and no refresh to remember.
Folded from the same rows
A report, a tile and the register page share one definition of “open”, “overdue” and “available” — so they cannot tell three stories about one Tuesday.
Bilingual by birth
Full en-CA / fr-CA parity on every screen, hint, empty state and refusal — plurals handled properly, not by concatenation.
Accessible to everyone
WCAG 2.2 AA as a build rule: charts carry text equivalents, states are announced in words, and focus moves to the field an error refers to.
Before you book the demo
Can we export a report to Excel or PDF?
Can a report be emailed on a schedule?
What can a report be built over?
What filters are available?
Can we group by two fields, or build a pivot table?
Why refuse instead of just showing no rows?
How is the dashboard different from a report?
Who can see a report I save?
Does the dashboard refresh itself?
Do you use a charting library?
Why is a number sometimes blank instead of zero?
Can we report on PM schedules, meters or labour hours?
Bring the figure nobody can reproduce.
Every organization has one — the compliance percentage that changes depending on who ran it, or the backlog that is forty-one in one report and thirty-eight in another. Give us the question and we'll show you the answer with its receipt: what it started from, and exactly what each filter took out.
Elsewhere in Zenith
Canadian industry guides
Standards and regulators
Standards are named by number, title and scope only. CSA and ULC publications are paywalled — read the standard itself before building a compliance programme on any summary.